Internet Explorer includes developer tools that provide a wealth of information about how the browser renders web pages. Developer tools are as important to HTML5 developers as debugging an app in Visual Studio is to .NET developers. In Visual Studio, the important key is F5, in Internet Explorer it’s F12. The question arises why I use Internet Explorer for this purpose. The answer is unequivocal. I consider the developer tools in IE to be the most transparent.
Direct CSS editing
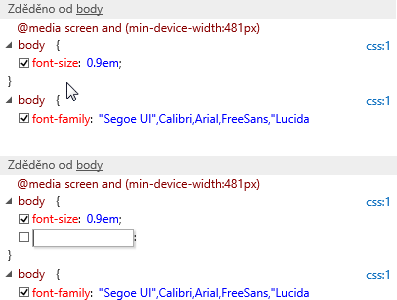
Fine-tuning borders, font size or even background color can be done directly in Internet Explorer. This feature has been around for a few years, but now it’s easy to add new styles.
Just click on the line with the end of the curly brace and a text box will be added where you can type the new rule.
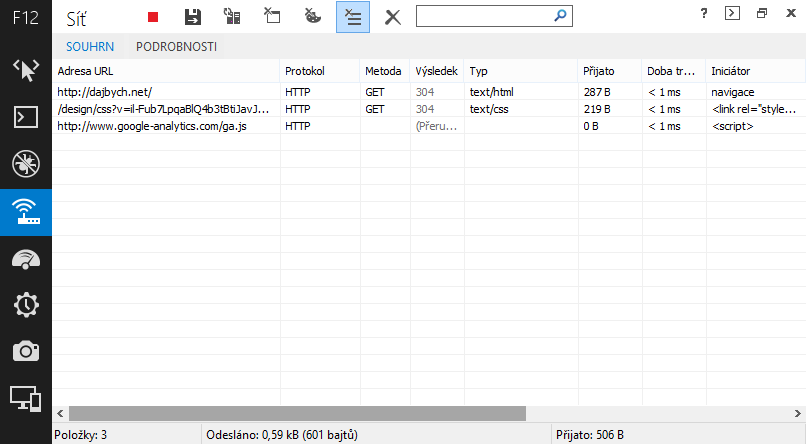
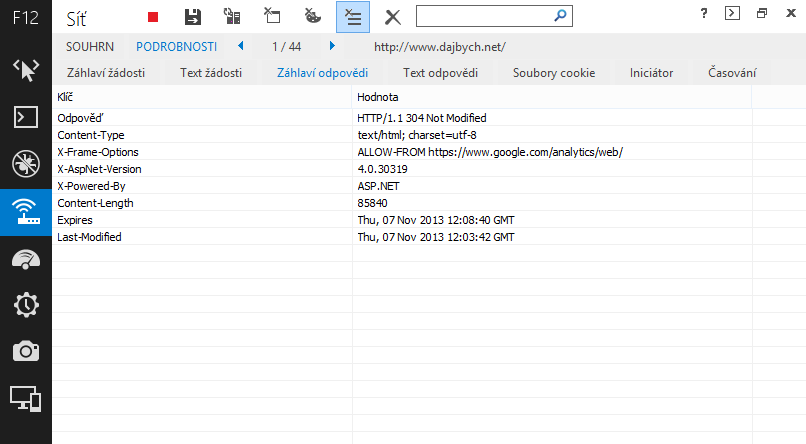
Clearer network measurement results
Website optimization cannot be done without measuring network flow. To check the HTTP response code, which should be 200 for the first request, 304 for the second, and 500 if possible for none, a summary report is best suited.
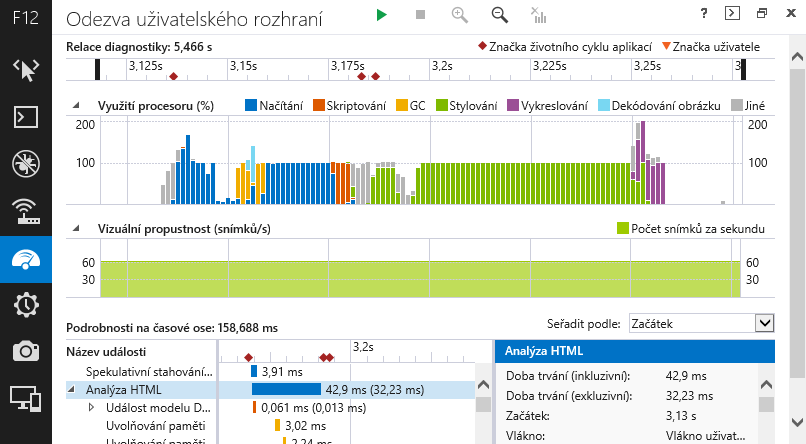
A detailed look at page rendering
UI Responsiveness Measurement renders a timeline on which we can mark a slice of our interest. A detailed bar graph shows the CPU usage of each browser subsystem. This makes it easy to see which activity is slowing down your site. For example, if they have too many cascading styles, go for style. If they use bad JavaScript, the browser spends a lot of time scripting.
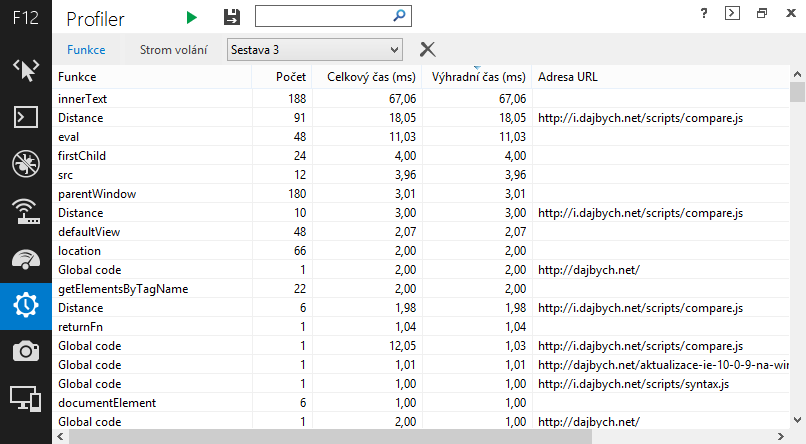
Timekeeping JavaScript methods
If your browser spends a lot of time scripting, you can use Profiler to easily see which parts of your code take the longest. Both the DOM methods used to manipulate the page and the actual javascript functions are displayed.
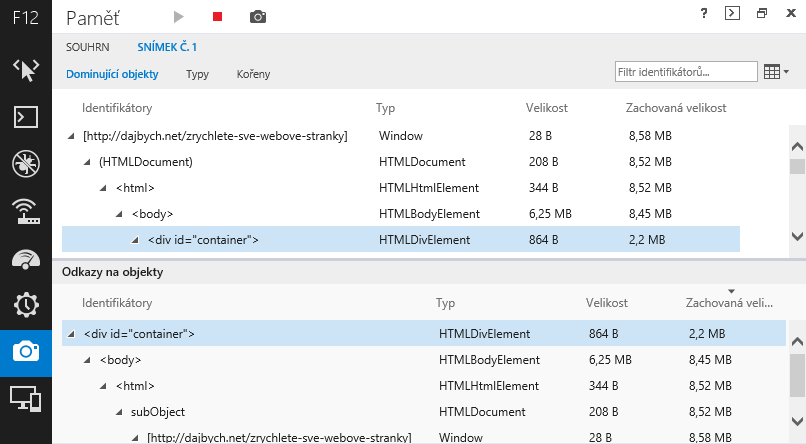
Measuring memory consumption
Few mobile phones have as much memory as desktop PC developers. The current situation is more like this: the size of the developer’s RAM is the same as the size of the Flash memory in the user’s mobile phone. Therefore, it is not a bad idea to keep memory requirements below a certain limit. To measure the amount of memory a page needs, you first need to create a heap snapshot. You can then scroll through it to find the parts of the page that have taken up too much memory.