Starting with a console app is simple. Writing a line of text to the console is easy, and the result is visible immediately. A similar situation is with a Universal Windows app where there is a TextBlock control. Service Fabric is not harder. The most difficult part is setting up your diagnostics because cloud services do not have any user interface.
Creating a Project
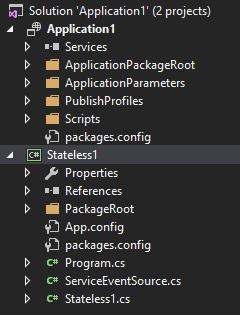
Launch Visual Studio as an Administrator. Open a New Project dialog (File → New → Project) and choose Service Fabric Application (Installed → Templates → Visual C# → Cloud). Select Stateless Service. The generated project is a hello world application. When you press F5 (or click Start), the Diagnostics Events window will appear and messages logged by the ServiceEventSource.Current.ServiceMessage method in the loop.
Understanding the Entry Point
Just like a console app has its Main method, every instance of a Service Fabric app has its StartAsync method. It is located in the Stateless1.cs file in the Stateless1 project. The method is called automatically after the instance is started in the same way the Main method is called after the console app is launched.
The question is when the method ends. Naturally, it ends when an exception is thrown and is not caught by your code. The console app shuts down, but the Service Fabric instance is restarted without the instance being recreated. In this case, the Service Fabric acts as a watchdog timer. But there is also another indicator signaling when the method should end. It may happen, for example, when the underlying operating system needs to restart after a system update. Two implementations exist. The first one throws an exception:
protected override async Task RunAsync(CancellationToken cancellationToken) {
  while (true) {
    cancellationToken.ThrowIfCancellationRequested();
    ...
  }
}
And the second one ends without reporting a transient fault:
protected override async Task RunAsync(CancellationToken cancellationToken) {
  while (!cancellationToken.IsCancellationRequested) {
    ...
  }
}
Both implementations are correct. The block inside the while loop contains your service logic.
Event Tracing for Windows
ETW is an efficient kernel-level tracing mechanism. You can consume the events in real time or from a log file. It does not slow down the application because it drops events when logging to a file if the disk is too slow to keep up with the logging rate.
Every event source has its name. It is defined in the EventSourceAttribute decorating the ServiceEventSource class in the ServiceEventSource.cs file. The Stateless1 class is registered with this class to ETW in the Program.cs file by calling the ServiceTypeRegistered method.
Service Fabric Analytics
OMS (Operations Manager Suite) allows your organization to centralize monitoring of various services regardless of their kind. It can also be used to monitor your Service Fabric cluster if you set up Azure Diagnostics on your Service Fabric VMs and configure OMS to collect data from your WAD (Windows Azure Diagnostics) storage table.
Application Insights
Another option is taking advantage of AI (Application Insights). The configuration was a little bit easier in the past by applying a single package, but this approach is deprecated now (most probably because it was bypassing ETW).
In order to connect AI to the ETW source, we have to include two projects from GitHub. Projects are not available as NuGet packages. You can keep always up-to-date by cloning the source repository, but this approach is very disruptive because you usually need the latest stable, well-tested version rather than the latest bits.
There is another choice. You can install the Microsoft.Diagnostics.EventFlow.ServiceFabric NuGet package. It has many dependencies and does not support .NET Core in this scenario. After installing the package, your project is richer by one file only, which is very positive. The file path is PackageRoot\Config\eventFlowConfig.json. In this file, you need to uncomment the section with Application Insights settings and paste the instrumentation key.
{
  "outputs": [
    {
      "type": "ApplicationInsights",
      "instrumentationKey": "00000000-0000-0000-0000-000000000000"
    }
  ]
}
Next, we need to identify the source of events, which is the value of the Name property in EventSourceAttribute decorating the ServiceEventSource class in the ServiceEventSource.cs file.
{
  "inputs": [
    {
      "type": "EventSource",
      "sources": [
        { "providerName": "MyCompany-StatelessService-Stateless1" }
      ]
    }
  ]
}
Finally, you have to replace the default entry point of the service host process with the diagnostic pipeline.
private static void Main() {
    try {
        using (var diagnosticsPipeline = ServiceFabricDiagnosticPipelineFactory.CreatePipeline("MyApplication-MyService-DiagnosticsPipeline")) {
            ServiceRuntime.RegisterServiceAsync("Stateless1Type", ctx => new Stateless1(ctx)).Wait();

            ServiceEventSource.Current.ServiceTypeRegistered(Process.GetCurrentProcess().Id, typeof(Stateless1).Name);

            Thread.Sleep(Timeout.Infinite);
        }
    } catch (Exception e) {
        ServiceEventSource.Current.ServiceHostInitializationFailed(e.ToString());
        throw;
    }
}
Unfortunately, even running this approach locally ends up with exceptions of various kinds depending on the target framework (.NET 4.5.2, .NET 4.6.2) and NuGet dependency behavior (lowest, highest).
My workaround
Install the Microsoft.ApplicationInsights.WindowsServer NuGet package.
Create an instance of the TelemetryClient class in a singleton or a static class.
using Microsoft.ApplicationInsights;
internal sealed class Stateless1 : StatelessService {
    private readonly TelemetryClient telemetry = new TelemetryClient();
    ...
}
Modify the ApplicationInsights.config file by inserting the instrumentation key into it.
<?xml version="1.0" encoding="utf-8"?>
<ApplicationInsights xmlns="http://schemas.microsoft.com/ApplicationInsights/2013/Settings">
  <InstrumentationKey>00000000-0000-0000-0000-000000000000</InstrumentationKey>
  ...
</ApplicationInsights>
Use the TelemetryClient as a gateway to your Application Insights telemetry.
protected override async Task RunAsync(CancellationToken cancellationToken) {
    long iterations = 0;
    while (true) {
        cancellationToken.ThrowIfCancellationRequested();
        telemetry.TrackTrace($"Hello World - {iterations}");
        await Task.Delay(TimeSpan.FromSeconds(1), cancellationToken);
    }
}
Deploying to a Service Fabric Cluster
The first step is to create a Service Fabric Cluster. I recommend creating a separate Resource group for it, because alongside the cluster, many other resources will be created – several storage accounts, a virtual machine scale set, a virtual network, a load balancer, and a public IP address. Future deletion of the Service Fabric cluster with all its dependencies will be much easier.
Service Fabric can be found in the Azure portal under New → Compute → Service Fabric Cluster.
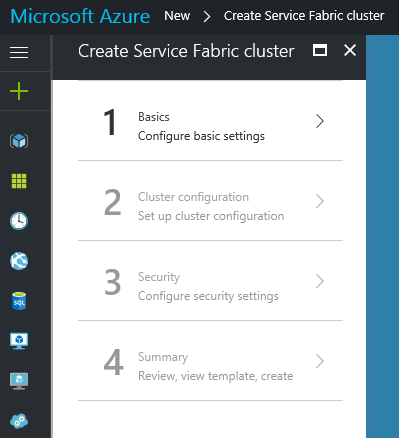
For testing purposes, I recommend the following configuration:
- Node type count: 1
- Durability tier: Bronze
- Virtual machine size: A0 Standard
- Reliability tier: Bronze
- Initial VM scale set capacity: 3
- Create application log storage: Off
- Security mode: Unsecure
When the cluster is created, select Publish… from the context menu of the Service Fabric Application project. Select the endpoint ending with cloudapp.azure.com:19000 and click Publish.
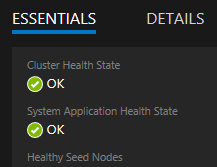
In the Azure Portal, on the Service Fabric panel, click on…
…and make sure your application is healthy.
In the Azure Portal, on the Application Insights panel, click on…
…and then click on the little +…
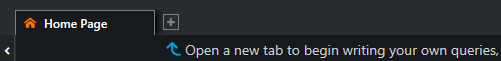
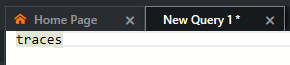
…write a single word…
…and click on…
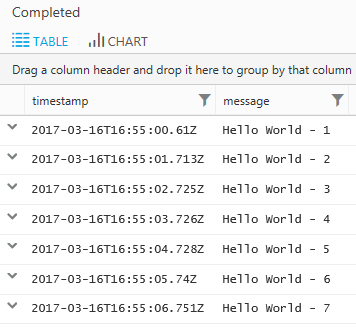
…then you can see your diagnostic messages from your cluster.
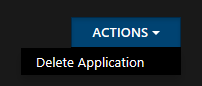
When you are done, you can delete your application from the cluster in the Service Fabric Explorer. To do so, select the application in the left panel and choose the Delete Application command under the Actions button in the upper right corner.