
Memory leaks are hard to detect and can cause serious problems. While a single job task running for a few seconds doesn’t have to care about them, a service running 24 hours a day must be carefully tuned to successfully fulfill its job. Moreover, memory leaks don’t have to be detected straight away; they usually appear as another exception, pointing you to problems in a different area. Let’s look at one example of a memory leak and how it showed up.
A good Service Fabric service propagates the CancellationToken to every possible awaitable call (why? read my previous article). Keeping this in mind, I consistently wrote code like this:
using (var conn = new SqlConnection("...")) {
    await conn.OpenAsync(cancellationToken).ConfigureAwait(false);
    using (var cmd = new SqlCommand("...", conn)) {
        ...
        using (var reader = cmd.ExecuteReaderAsync(cancellationToken)) {
            while (await reader.ReadAsync(cancellationToken)) {
                ...
            }
        }
    }
}
The code looks good, right? Using statements for everything IDisposable, well-established ADO.NET technology with a long history dating back to August 1996. I thought that nothing here could go wrong at all, but I was wrong. The code above contains a memory leak. It is not visible and it doesn’t throw an OutOfMemoryException.
The caught exception was different. It was a Win32Exception with the statement:
A connection was successfully established with the server, but then an error occurred during the pre-login handshake.
Moreover, the rising exceptions weren’t consistent. Sometimes the error message looked like this:
The client was unable to establish a connection because of an error during the connection initialization process before login. Possible causes include the following: the client tried to connect to an unsupported version of SQL Server; the server was too busy to accept new connections; or there was a resource limitation (insufficient memory or maximum allowed connections) on the server.
This message was very helpful because an unsupported version of SQL Server is very unlikely with SQL Database in Azure, and Query Performance Insights shows performance problems more accurately than exceptions in Application Insights. Additionally, the Service Fabric cluster reported something different:
SourceId='System.FabricNode', Property='SecurityApi_CertGetCertificateChain', HealthState='Warning', ConsiderWarningAsError=false, …

I compared the actual code with the latest stable version and found the problem. It is the SqlDataReader.ReadAsync method that contains a memory leak. The underlying bug in this method was already reported prior to my investigation, so my job was much easier. It is fixed in .NET 4.7, which became generally available in May 2017. I cannot say whether this bug also causes my memory leak at this point in time. I just returned to a synchronous call. It is much easier than forcing the underlying Virtual Machine Scale Set with Windows Server 2016 to install the latest .NET Framework (and again after every possible cluster recreation).
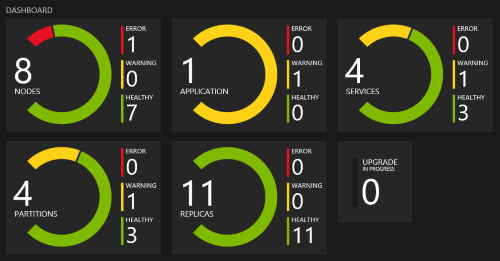
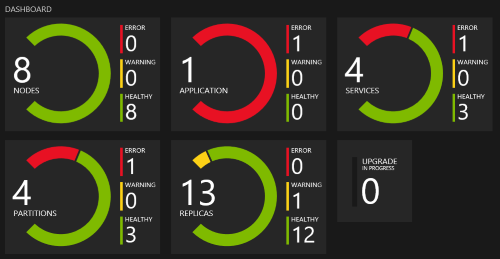
The Service Fabric service can be updated in a Monitored mode. It can roll back when the new version fails due to bugs exhibited during big data processing only – typically memory leaks. An unhealthy service does not necessarily mean that the service is raising any exceptions. It also means it is not processing as much data as expected – typically because of memory swapping.