
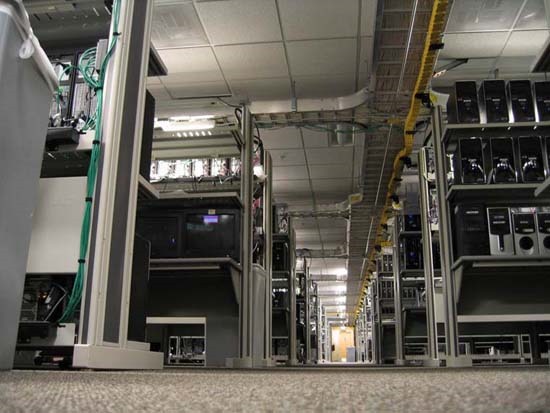
Over the past five years, a laboratory has been gradually built in Redmond to test the reliability and performance of Internet Explorer. Today, it is one of the most sophisticated web measurement tools. It runs 200 Internet Explorer performance tests per day, performs 5.7 million measurements and collects 480 GB of data. The measurement takes place every 100 nanoseconds. For each change in the IE source code, it is known what impact it had on its performance.
The laboratory is a miniature version of the Internet. It consists of more than 140 machines of various types. It includes desktops, laptops, netbooks and tablets with x86, x64 and ARM processors. It includes web servers, DNS servers, routers, and network emulators that simulate different types of connections. The network allows you to remove all sources of chance. All tests performed can be deterministic and can therefore be repeated at any time.
The laboratory uses Windows Performance Tools (WPT), thanks to which it is possible to run the same tests and compare the results. They can run for various browsers, toolbars, antivirus programs, and other third-party programs. WPT can measure everything from CPU and GPU load to cache efficiency, network load, and memory usage. All this to ensure that the hardware, drivers, Windows, and Internet Explorer are optimized for each other. One test takes about 6 hours and creates 22 GB of data. The infrastructure of the laboratory consists of three units – network and servers, clients and measuring equipment.
How it’s measured
Web Servers
Web site servers contain copies of real pages from the Internet. Their source code is just modified to be deterministic. For example, a function call Math.Random is replaced by a static value. Dynamic URLs are replaced by static URLs. The web application is implemented in such a way that a hash is created from the URL, according to which the static HTML code is found, which is cached in memory. Each server has 16 cores and 16 GB of RAM. In addition, the laboratory also contains separate servers that run Outlook Web Access and Office Web Apps.
Network emulators
Some network connections have hardware emulators applied to delay and reorder packets. Depending on the specific configuration, they emulate 56k, DSL and cable modems or WAN and 4G networks. Although this solution is more complex and expensive than using a software solution or proxy, it is the only way to accurately measure performance. The browser has a limit on the number of simultaneous connections to the proxy, so it would affect the measurement. A software emulator on a client would use its performance and thus invalidate the measurements, especially on battery-powered devices.
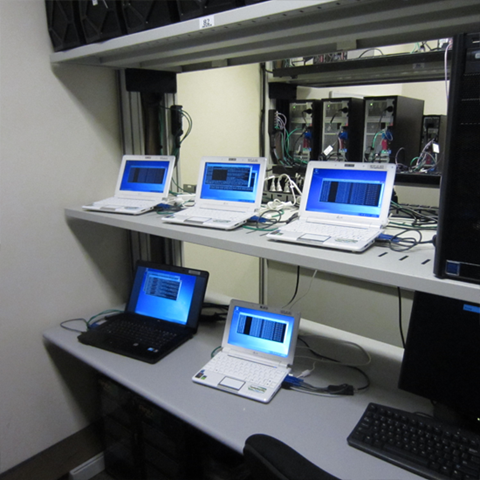
Clients
The laboratory contains 120 machines running the latest stable build of Internet Explorer from the TEST branch (there is also a DEV and a MAIN branch on TFS). The individual machines are very different and represent a wide range of devices - from tablets and netbooks to powerful x64 desktops. Some have an integrated graphics card, others don't.
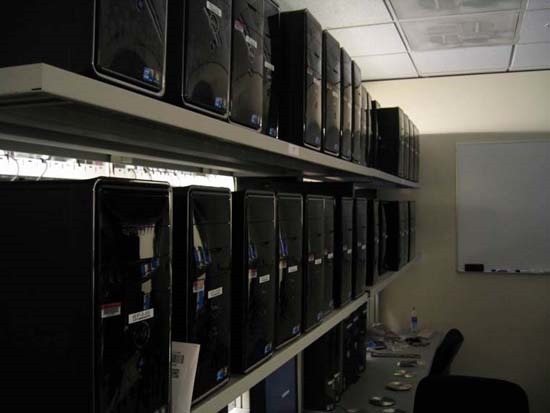
Clients are grouped. In each group there are computers with exactly the same hardware. When a fault occurs, the machine is almost always accelerated after replacing the defective component with a new one. When measured to an accuracy of 100 nanoseconds, even a few clocks can affect the result. When this happens, the computer is removed from the group.
When measuring IE graphics performance, machines from the second Windows graphics performance measurement lab, which includes almost every type of chipset produced, are used. This lab is invaluable in investigating a bug across chipsets and graphics card driver versions.
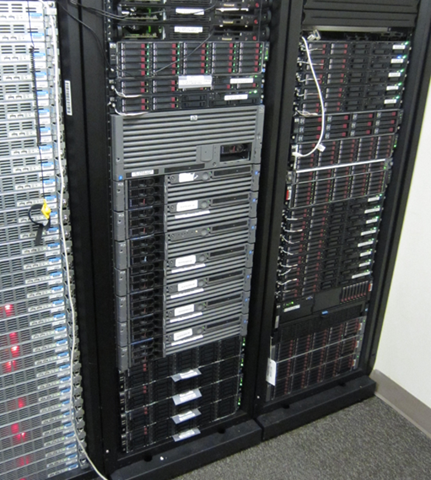
Measuring technology
The measurement data is first collected. They are analyzed on standalone HP ProLiant DL160 G6 servers. It has 16 cores and 16 GB of RAM. The thousands of metrics that are calculated are eventually stored on SQL Server. It collects 6 million measurements made every day. It runs on a 24 core server with 64 GB RAM.
What is measured
Loading content
First of all, navigation from one page to another is measured. This includes measurements across the eleven layers of Internet Explorer, which together load a new page.
- The network layer takes care of communication with servers and local caching.
- The HTML layer takes care of both HTML parsing and DOM (Document Object Model) assemblies.
- The CSS layer takes care of assigning styles to individual elements in the DOM.
- The metadata collection layer retrieves data from meta tags and HTTP headers for later use.
- The JavaScript layer is probably the most well-known. It employs additional layers even after the page loads.
- The marshaling layer loads ActiveX elements and Visual Basic Script. In short, components that are not implemented directly in IE.
- The native OM layer makes the DOM accessible to these external components.
- The formatting layer builds from the DOM and cascading style sheets of the Display Tree.
- The next layer assembles rectangular blocks that are displayed to the user.
- A layout layer builds a page from individual blocks.
- Finally, the rendering layer uses DirectX or GDI+ to render the page.

By careful measurement on all these layers, such statistics are created. They are the key to deciding which parts of Internet Explorer need to be optimized or reimplemented. They tell at a glance whether a site uses a large number of JavaScript libraries or uses an excessive number of cascading styles.
XmlHttpRequest
Another area that is subject to measurement is the dynamic loading of data in the form of XML and the subsequent modification of the page using JavaScript. The measurement is based on the source code of popular short message sharing sites, social networks and applications such as Outlook Web Access and Office Web Apps.
User interface
Equally important is the measurement of the browser environment itself. The most important interactions include opening and closing the browser, switching tabs, resizing the keyboard, mouse or touch, and handling history or favorite sites.
Sampling
Very well-known and often overrated tests, such as WebKit SunSpider, are also in the lab. They are useful for load testing a specific browser layer. However, these tests simulate behavior that rarely occurs on the regular web. Rather, the tests were written to show the shortcomings of specific browsers and to highlight their differences. Therefore, emphasis is placed primarily on tests that test the browser as a whole.
A special internet search engine is used to select test sites. On the website, it measures 68 different indicators. These include, for example, the width and depth of the DOM tree, the complexity of CSS rules, the JavaScript frameworks used, or language differences (which are called international features in Redmond). Based on this survey of the site, stands are selected for testing in the laboratory. This ensures that the site selection is sufficiently representative.
Metrics
Browser performance cannot be expressed in one number. Tests that try to do this always focus on a specific area. In total, over 850 different metrics are measured. Together, they form a mosaic of Internet Explorer performance. First of all, five main areas are monitored.
- The time that elapses from the time the user clicks on the link to the time the page loads.
- The time from page load to completion of background tasks (such as sending data to site traffic servers).
- The CPU load, which is a bottleneck in the case of websites (if we ignore the network). Therefore, the rendering itself has moved to the GPU with the ninth version of IE.
- Delays caused by resources such as networks, GPUs, RAM, SSDs or HDDs and hundreds of others.
- Power consumption on battery-powered devices, especially when using HTML5 video. This data is collected from Windows via ETW (Windows Event Tracing Infrastructure) and VMMap (virtual and physical memory analysis utility). ETW collects memory stack images every 10 microseconds. With the help of debugging symbols, the individual frames can then be browsed backwards.
Third-party software measurement
Many applications use Trident. Internet Explorer extensions are tested by comparing browser tests with and without an add-on. The main focus is on browser launch time and page load time. Many add-ons send requests to the servers during page loading. However, some do it synchronously, which logically slows down its loading. Not to mention situations when the firewall is carefully set or the computer is offline.
A faster browser for everyone
Browser speed is very important. Careful measurement of Internet Explorer ensures its quality across the large amount of hardware it runs on. The data measured by the lab is not only used for its development, but also contributes to the optimization of Windows and the design of faster PC hardware.
The article was written for TechNet Blog CZ/SK.